
Water Access in the Desert: Shifting Strategies for Agricultural Land Use
As water becomes more scarce, space data can help evaluate strategies for water usage, understanding the impacts and implications of retiring and changing centuries-old agricultural land.
Welcome
Can we use satellite data to understand the usage of land in Arizona and identify locations where agricultural land use is predominant?
Can we trace changes in environmental and drought conditions to impacts on land use in these regions?
Using additional data sources outside of satellite imagery, what recommendations could be made for a policy, strategy, and plan for retiring agricultural land use in Arizona in a sustainable manner? What are the impacts of these changes?
What mitigation strategies can be implemented to support a change in land use in Arizona that better supports sustainable water usage across the US, while ensuring proper land dynamics, socio-economic considerations, and efficient crop production?
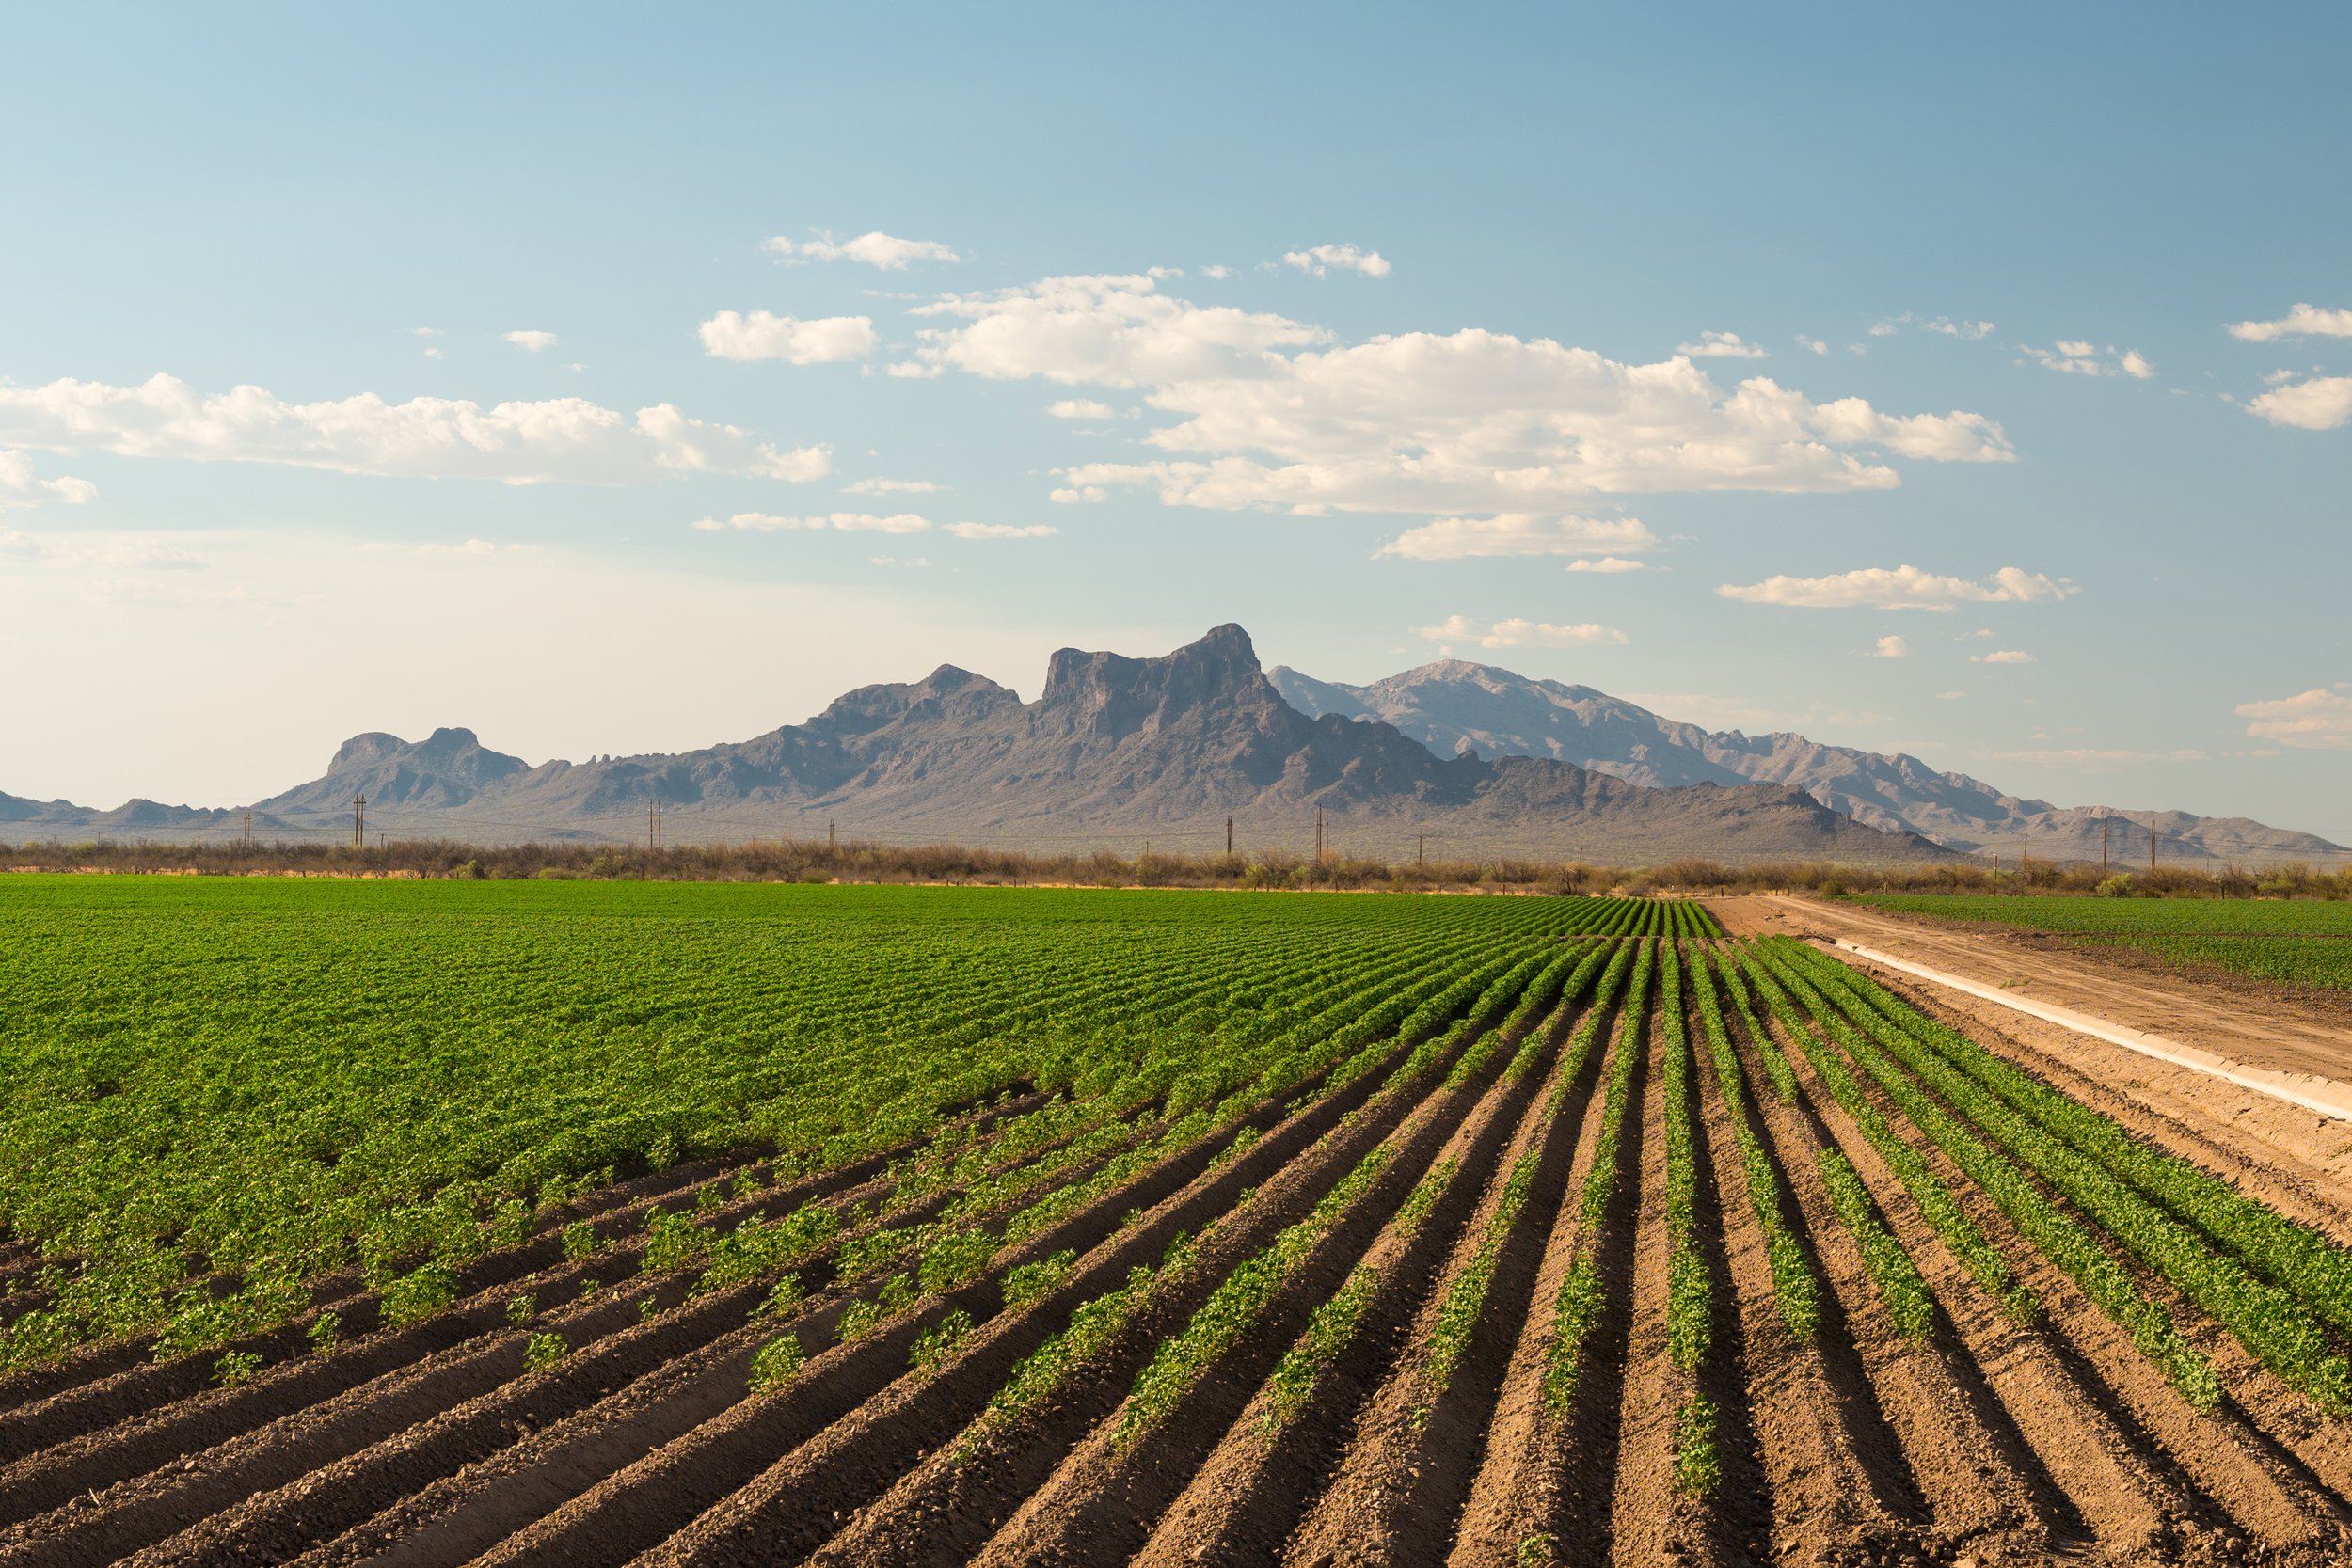
We all have assumptions about water access in the desert - usually associated with scarcity, higher-costs, and infrequent or inconsistent supply. However, water access in Arizona is a bit different than what is commonly thought of in the desert. With an infrastructure that seamlessly moves water throughout the Southwestern United States, this robust system provides a reliable and cost-efficient flow of water throughout Arizona. In fact this infrastructure is so seamless, it manifested a completely different problem - enabling a complex ecosystem of agriculture and farmland to be established in the desert.
Nearly three quarters of Arizona’s water is used for agriculture and when this enabling infrastructure was set up, the issue of water scarcity in the US wasn’t a concern. Now with changing climate patterns and global warming resulting in increased, more widespread, and longer lasting droughts in the US we must reevaluate our agricultural usage of water. But this problem is not as simple as just stopping agricultural land use in Arizona. Doing so would have widespread impacts - from economic, environmental, and air quality to emissions outputs, fossil fuel use, and crop yields.
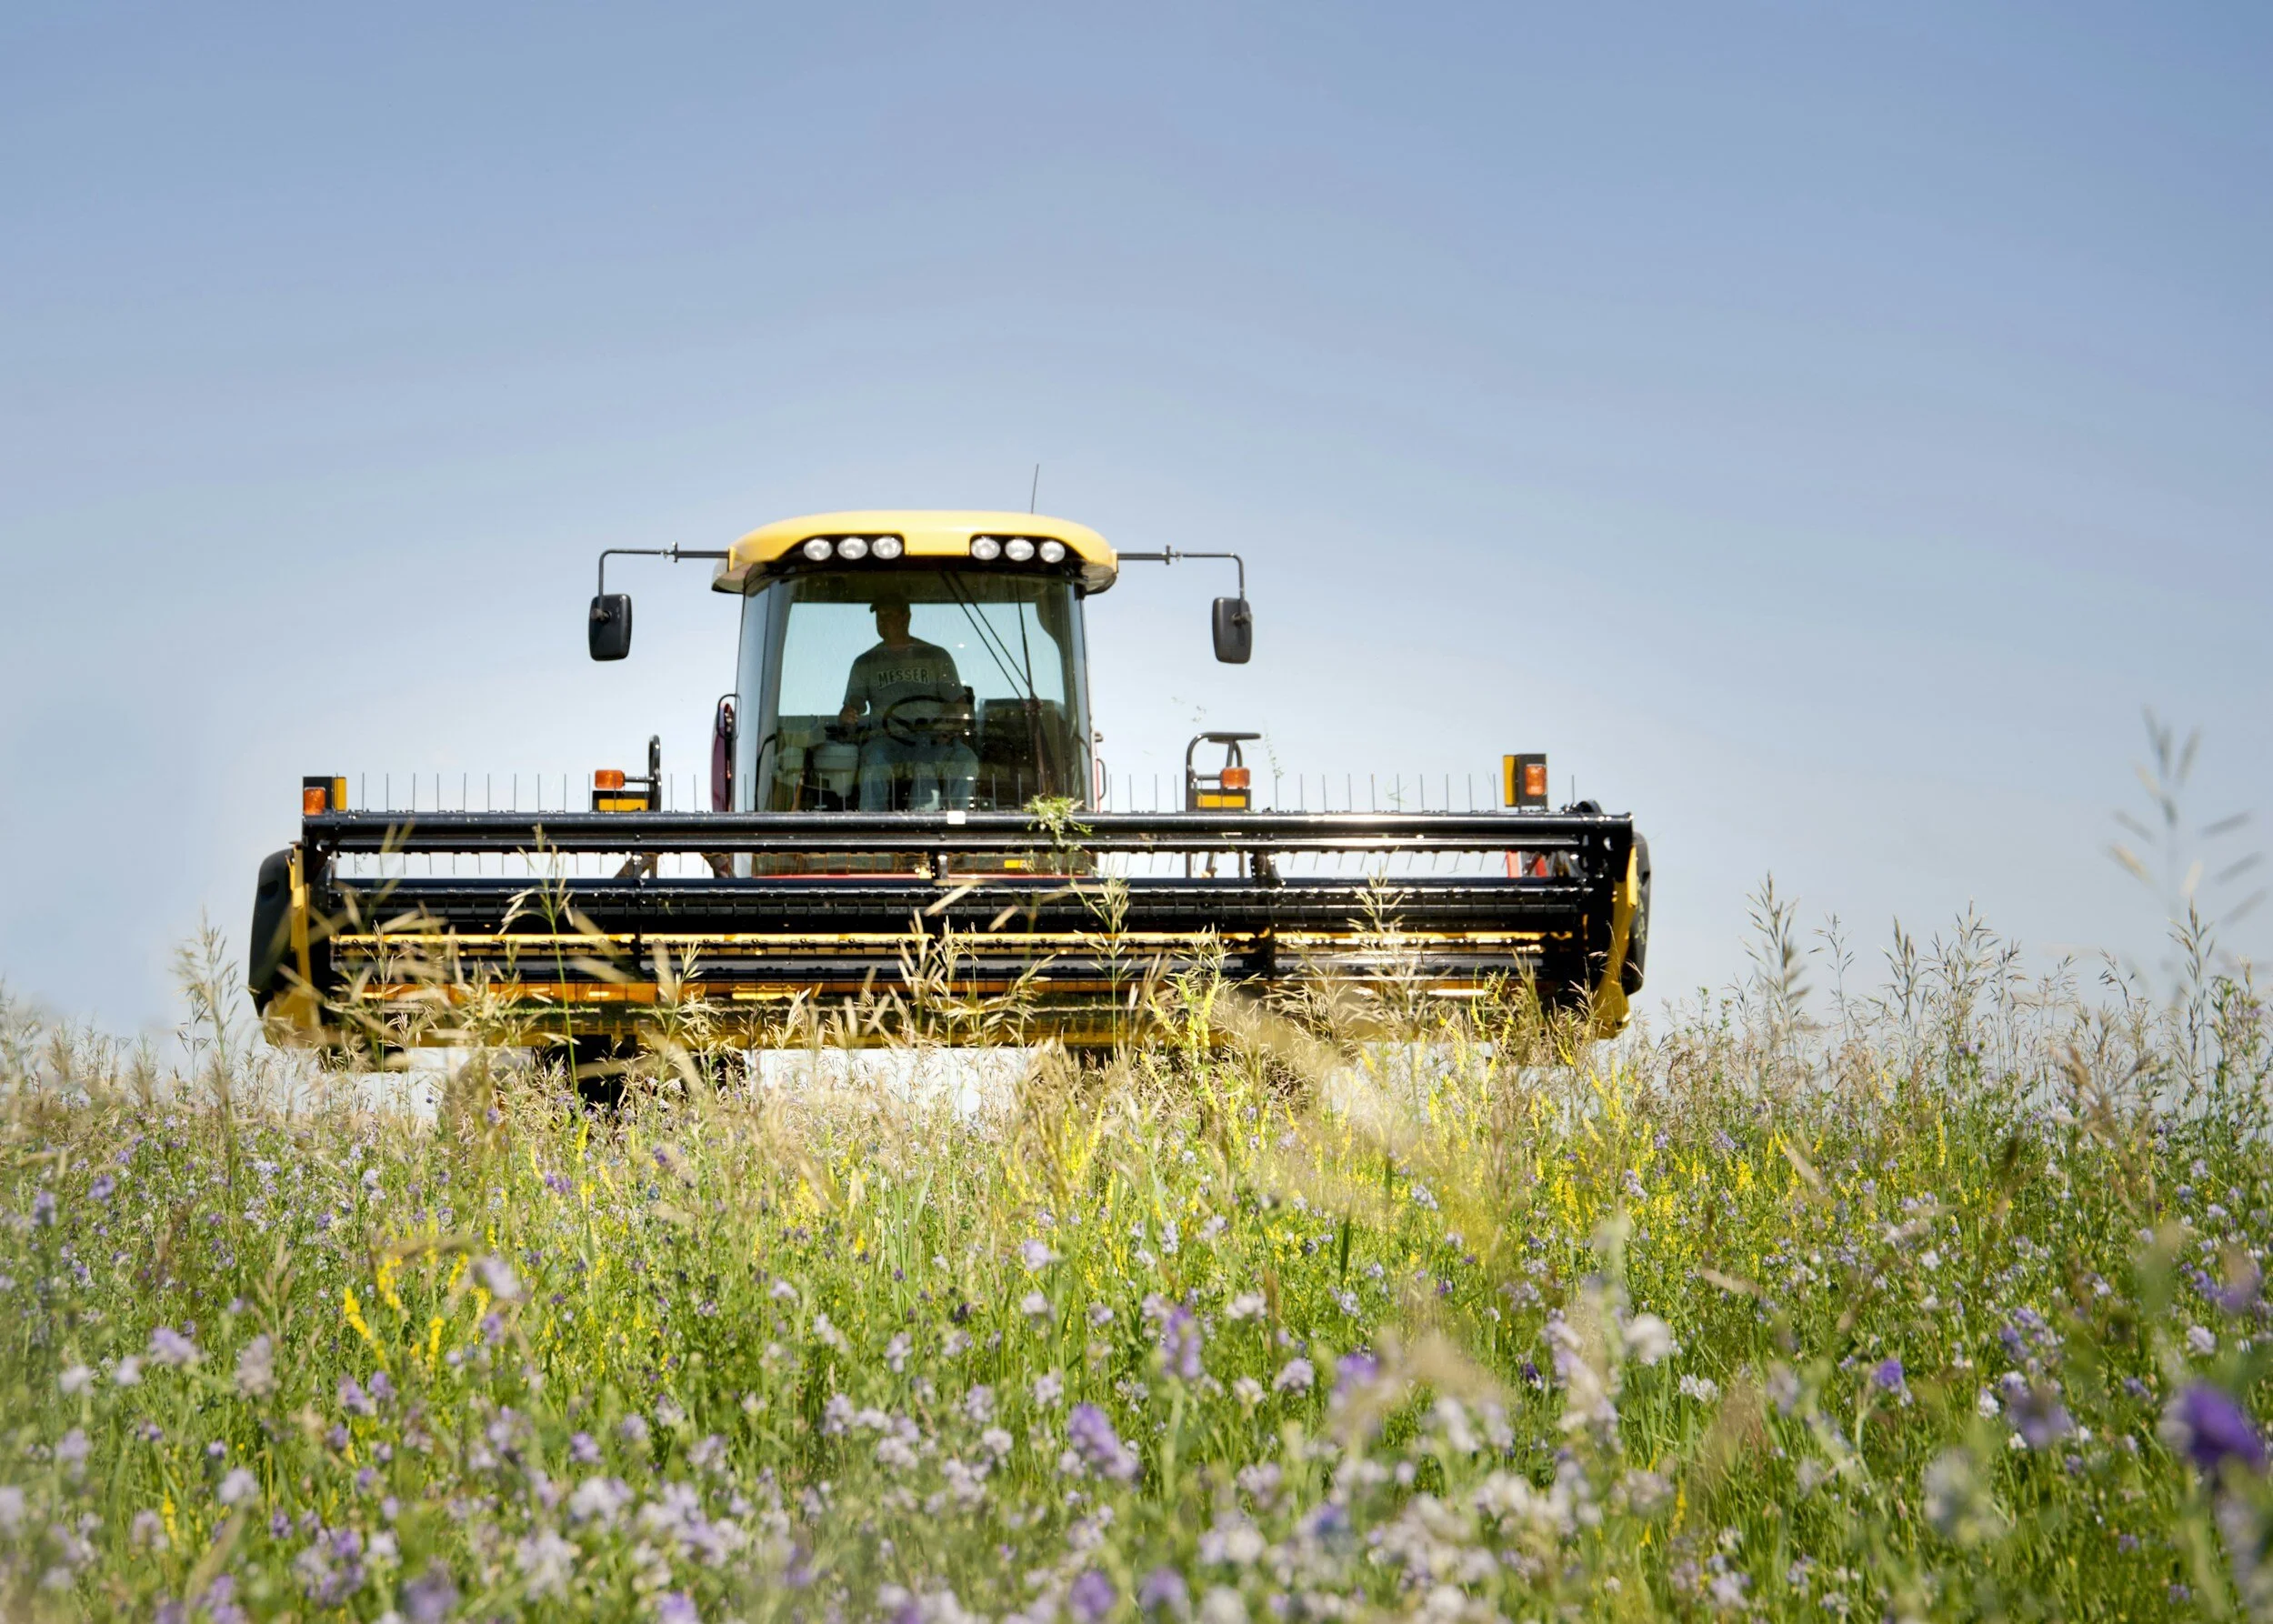
This project seeks to better understand the impacts of historic droughts on water availability in Arizona and asks students to explore whether to retire agricultural land in Arizona and what the implications to the recommended change in land use would be. Further, students are asked to explore mitigation strategies to address the impacts on the region’s economy, environment, and “lost food”. Satellite data can be used to build recommendations based on current land use, climate conditions, and soil moisture, as well as modeling mitigation strategies for the future.
Problem Statements
Understanding the Problem: Background Resources


Arizona Water Blueprint

Desert Agriculture Track Resources
Below is a list of resources and data sets that are applicable this tracks and are a helpful way to get started.
(Resources for additional datasets: Earth Engine Data Catalogue & Awesome GEE Community Catalog)
The U.S. Drought Monitor is a map released every Thursday, showing parts of the U.S. that are in drought. The map uses five classifications: abnormally dry (D0), showing areas that may be going into or are coming out of drought, and four levels of drought: moderate (D1), severe (D2), extreme (D3) and exceptional (D4)
Samapriya Roy, Erin Trochim, Valerie Pasquarella, Édith Darin, & Tyson Swetnam. (2023). samapriya/awesome-gee-community-datasets: Community Catalog (1.0.5). Zenodo. https://doi.org/10.5281/zenodo.7712869
Global River Width from Landsat (GRWL)
NASA Harvest Layers
Global irrigation areas (2001 to 2015)
Global river networks & Corresponding Water resources zones
HiHydroSoil v2.0 Layers
HydroATLAS v1.0
The Landsat-Derived Global Rainfed and Irrigated-Cropland Product (LGRIP) provides high resolution, global cropland data to assist and address food and water security issues of the twenty-first century
Hosts the Cropland Data Layer (CDL) and allows users to easily conduct area and statistical analysis of planted U.S. commodities, geolocate farms, and map areas of interest.
The Crop Sequence Boundaries (CSB), developed in collaboration with the USDA's Economic Research Service, provides estimates of field boundaries, crop acreage, and crop rotations across the contiguous United States.
The mapped variables over CONUS include soil texture, organic matter, pH, saturated hydraulic conductivity