
Mangrove Assessment and Flood Management in Tropical Coastal Cities: The Case of Greater Guayaquil
Problem Statement:
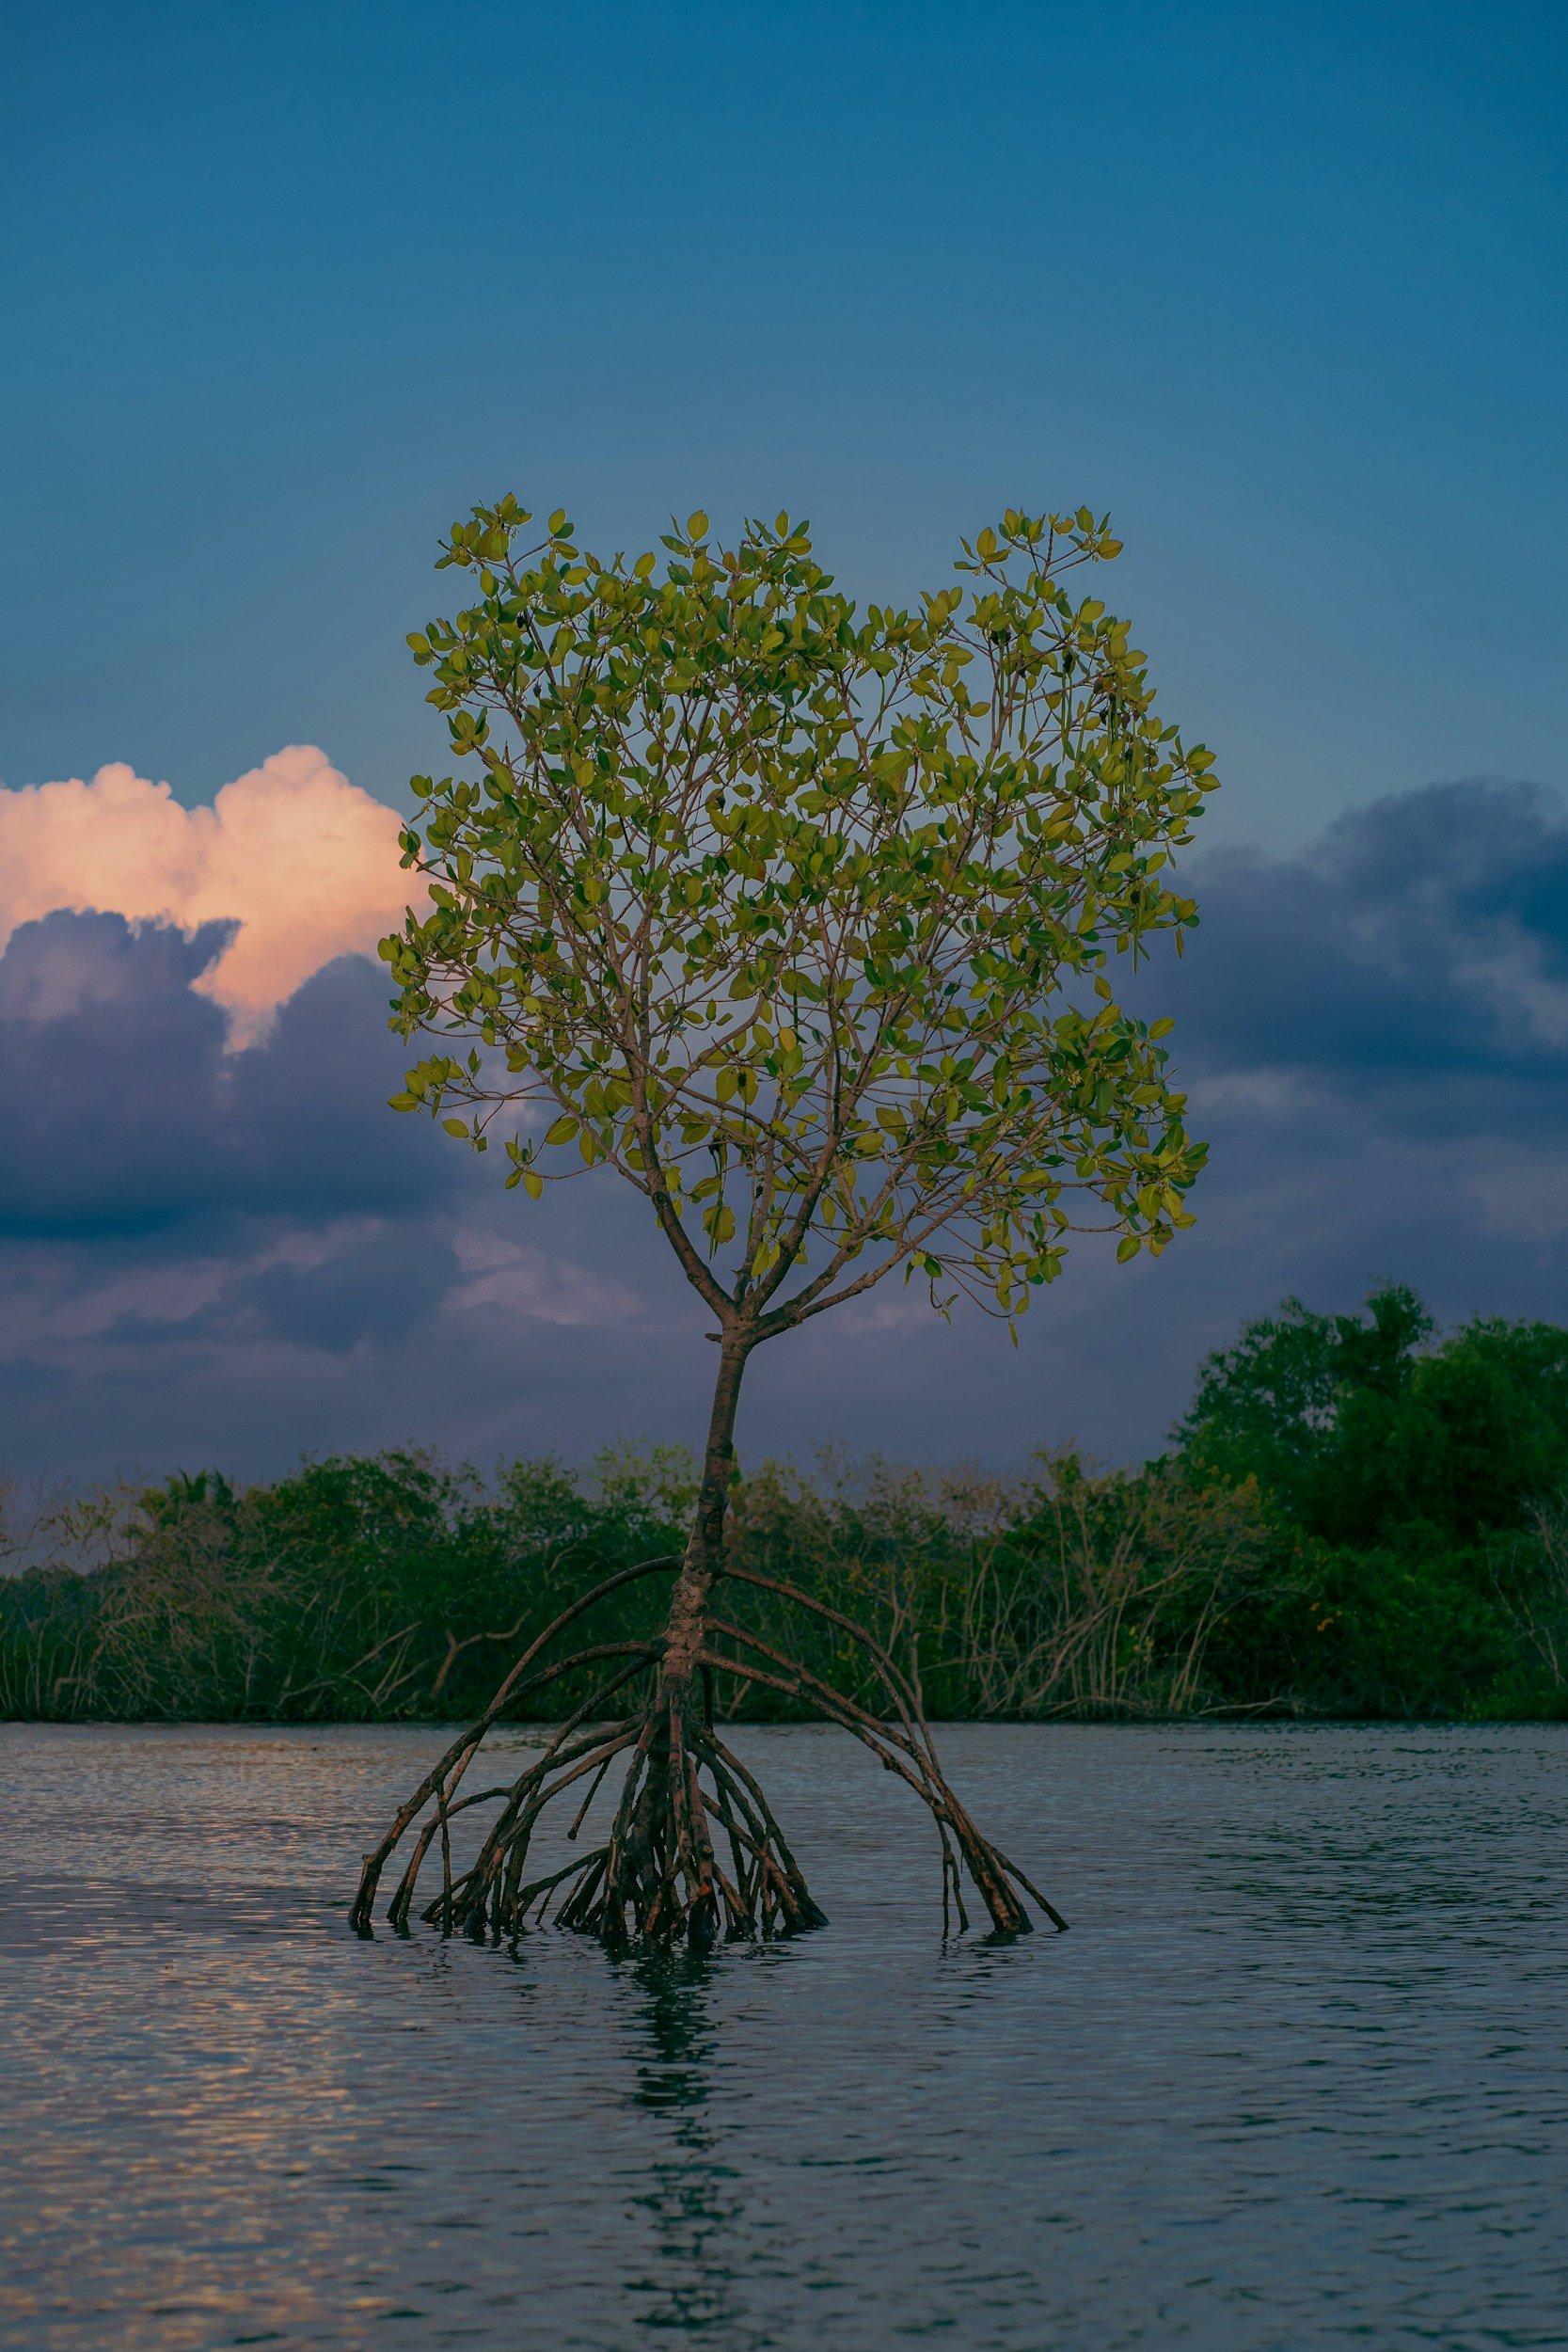
Coastal cities in tropical zones face a recurring increase in flooding driven by poorly planned land-use changes and sea-level rise associated with global warming. Although mangrove forests are known to act as a natural infrastructure capable of buffering tides, extreme rainfall, runoff, and flooding, their protective role is not sufficiently integrated into urban planning in tropical regions. This lack of understanding of the importance of mangroves as protective barriers, along with the multiple ecosystem benefits that mangrove forests provide, leads to insufficient attention to their protection, conservation, and promotion of their expansion.
The cities of Guayaquil, Durán, Daule, and Samborondón (known as Greater Guayaquil) are located in the inner part of the Gulf of Guayaquil in Ecuador (South America) and currently face a growing flood risk. With more than 3.3 million inhabitants and a high population density, Greater Guayaquil has expanded along the banks of the Daule, Babahoyo, and Guayas rivers, a territory naturally vulnerable to water. This is compounded by increasingly intense climatic phenomena: between 2023 and 2025, extreme rainfall exceeding 70 mm in a single day has been recorded, often coinciding with high tides in the Guayas River reaching up to 5 meters. When rain and tides occur simultaneously, urban drainage systems fail to respond adequately, leading to frequent flooding.
Given this context, the aim is to use satellite and publicly available web data to assess the spatial distribution of mangroves around coastal cities. This will allow for the evaluation of coastal protection in tropical areas with populations of more than one million inhabitants, particularly in Greater Guayaquil. Furthermore, this data will provide information on the health of the mangrove forests and identify areas with potential mangrove loss or growth over the past 10 years. The analysis will enable the development of innovative proposals to increase, conserve, manage, and monitor mangroves across different areas around the cities analyzed, particularly in the Greater Guayaquil area.
Tagline: How can mangrove ecosystems be assessed, managed, and restored to enhance flood resilience and reduce economic losses in Greater Guayaquil under various climate conditions?
Research Questions:
What percentage of the coastline of the analyzed cities (Greater Guayaquil) is protected by mangroves against potential flooding? Is it possible to increase this percentage? Explain where, how, and why you would do so in the selected areas.
Could a map be created showing areas of mangrove loss or increase over the last 10 years, displaying their respective rates of loss or increase? Have areas with mangroves undergoing degradation been identified? Design a strategy or tool to continuously monitor this dynamic of the quantity and health status of the mangroves.
Could areas exposed to flooding due to the lack of mangrove protection be identified, and could the affected areas be calculated, along with an economic quantification of potential losses? Design a strategy to raise awareness, as a priority, among populations that could be affected by flooding, about the importance of being prepared for this event, considering the use of mangroves as a natural option where ecological conditions allow.
How do mangrove width, density, and ecological health influence flood attenuation capacity in Greater Guayaquil?
Is there a measurable relationship between mangrove belt width and reduction in flood extent or water depth?
Can you measure the relationship between mangroves and their greater protective benefits based on their NDVI values?
Can we find minimum mangrove width that is required to significantly reduce flooding under different rainfall–tide scenarios?
Note: this question asks to combine remote sensing, flood models, and spatial analysis to quantify protective performance of mangroves, not just their presence.
How has urban expansion over the past 10–20 years affected mangrove cover and flood exposure in Greater Guayaquil?
To what extent is mangrove change (loss or fragmentation) associated with urban expansion? Can we track this association?
Has urban expansion occurred disproportionately in historically protected or high-risk areas?
Are newly urbanized areas more exposed to flooding due to mangrove removal?
Note: This asks to integrate land-use change analysis (Landsat time series), urban growth mapping, and flood-risk overlay analysis.
To what extent would different mangrove restoration scenarios reduce projected flood extent and economic losses in Greater Guayaquil?
How would restoring mangroves to historical extent alter modeled flood depth and spatial extent under rainfall–tide scenarios?
What percentage of exposed population and infrastructure would move from high- to moderate-risk categories under restoration scenarios?
What are the estimated avoided economic damages under each restoration scenario?
Note: This asks to explore relationship between different restoration strategies and prevention of flooding and economic loss.
Background Information
Mangroves mean life for coastal communities throughout the tropics (World Wildlife Fund, 2025)
Guide to the Mangroves of Ecuador: A Study Combining Academia and Community Knowledge (Spanish), (Molina-Moreira et al., 2024)
The State of the World’s Mangroves, (Global Mangrove Alliance, 2024)
Protecting mangroves can prevent billions of dollars in global flooding damage every year, (The Conversation US, 2020)
Track Resources:
Below are applicable resources and data sources to get started!
Global Mangrove Extent Change 1996–2020: Global Mangrove Watch Version 3.0 (Bunting et al, 2022): This research paper describes the development of Global Mangrove Watch Version 3.0, detailing the methods and processes used to create global mangrove extent databases and change maps from 1996 to 2020.
Data Sources (Non-restrictive)
Global Mangrove Watch Version 3.0 (dataset): spatial data that presents a comprehensive record of global mangrove change from 1996 to 2020; this is one of the most complete records to date. The dataset is versatile and can be used in activities such as monitoring of the global coastal environment, assessing changes in mangrove population conservation, identifying protected areas, and assessing loss risk of mangrove ecosystems across the globe. The spatial layers are provided as both raster GeoTIFFs and vector ESRI Shapefiles. The dataset includes an excel document with country level statistics for mangrove extent and change, with their corresponding upper and lower confidence intervals.
NASA Global Mangrove Distribution, Aboveground Biomass, and Canopy Height (Version 1.3) dataset provides a high-resolution (30 m) global map of mangrove forests for the nominal year 2000, estimating their spatial extent, aboveground biomass (AGB), maximum canopy height, and basal area–weighted height across tropical and subtropical regions worldwide. Developed using spaceborne lidar data from ICESat (GLAS), elevation data from SRTM, and extensive in situ field measurements, the dataset combines remotely sensed canopy structure with region-specific allometric models to quantify mangrove forest structure and carbon stocks. One way to access the data is 1) click on the dataset website, 2) choose download on Earth data search row, 3) click on the data name that says 349 granules, it will open up all 349 (you can scroll down to see all), 4) find ones among those 349 that are about Ecuador. You can search on map, selecting on map using polygon, rectangle etc. on the right side of the opened map. Once you find the data, you will just click on download. Keep in mind that it will ask you to create an account if you don’t have one already.
The Monitoring of the Mangrove Ecosystem on the Coast of Ecuador (2018–2022) dataset, published in the SERVIR Amazonia Dataverse (Harvard Dataverse), provides 10-meter spatial resolution maps of mangrove and non-mangrove cover for the Ecuadorian coast (Guayas province) for the years 2018, 2020, and 2022, along with a change detection map identifying gains and losses greater than 0.5 hectares between 2018 and 2022. The dataset was produced using the MANGLEE tool developed by the EcoCiencia Foundation under the SERVIR-Amazonia program (NASA-USAID initiative), integrating Sentinel-1 (SAR) and Sentinel-2 optical satellite imagery processed in Google Earth Engine and classified using a Random Forest machine learning approach. The workflow includes data preprocessing, vegetation index calculation, supervised classification, pixel-level change detection, and validation through ground truth data and visual interpretation.
Monitoring of the Mangrove Ecosystem in the Province of Guayas–Ecuador during the Period 2018–2022 (Version 1.1) provides 10-meter spatial resolution mangrove cover maps for 2018, 2020, and 2022, as well as mangrove change maps for the periods 2018–2020 and 2020–2022, specifically for the province of Guayas, Ecuador. Developed using the MANGLEE tool on Google Earth Engine, the dataset integrates Sentinel-1 (SAR) and Sentinel-2 optical imagery and applies Random Forest classification to generate binary mangrove/non-mangrove maps and detect changes greater than 0.5 hectares, validated with ground truth and visual interpretation. Unlike broader SERVIR Amazonia dataset covering entire Ecuadorian coast (Version 1.0), this version is geographically limited to Guayas, provides change analysis in two separate intervals rather than a single 2018–2022 period, is distributed primarily as shapefiles (vector format), and is licensed under CC BY 4.0 (requiring attribution) instead of CC0 public domain.