
Quantifying changes over time.
Welcome to our last GIS module!
In this module, we'll look at how to quantify change on your map over a select time frame by looking at the Paradise Fire, also known as the Camp Fire, which occurred in November 2018 and is recognized as California's deadliest and most destructive wildfire ever. This module will quantify the difference in vegetation between the pre- and post- fire time periods.
.
“So long, and thanks for all the fish!”

Track changes
This code uses the Google Earth Engine to compare vegetation health before and after the Paradise Fire of 2018 by analyzing NDVI values from MODIS satellite imagery within a defined area around the town of Paradise. It calculates and visualizes the average NDVI to assess the impact of the fire, then displays these findings both as map layers and a comparative bar chart.
Step-by-Step Explanation of the Code explanation
Step 1 Defining Time Ranges
First, the code defines time ranges to compare vegetation before and after the Paradise Fire, which occurred from November 8 to November 25, 2018. The preFireStart and preFireEnd variables set the period before the fire, while postFireStart and postFireEnd define the period after the fire. This allows for the analysis of vegetation health across these two distinct time frames.
Step 2: Specifying the Area of Interest
The paradise variable defines a geographical rectangle that approximates the area around the town of Paradise. This uses coordinates to create a rectangle shape that Earth Engine will use to focus its analysis, ensuring that data is only gathered from within this specified area.
Step 3: Selecting the Dataset and NDVI
Next, the code selects a specific dataset (MODIS/061/MOD13Q1) that includes vegetation indices, specifically the Normalized Difference Vegetation Index (NDVI). NDVI is a measure of the health and density of vegetation. The .filterBounds(paradise) method restricts the dataset to only include data from within the Paradise area, and .select('NDVI') further narrows the data to just the NDVI values.
Step 4: Calculating Average NDVI
To understand vegetation health before and after the fire, the code calculates the average NDVI for both time frames using .filterDate() to select the relevant dates and .mean() to calculate the average. This results in two variables, preFireNDVI and postFireNDVI, representing the average vegetation health before and after the fire, respectively.
Step 5: Visualizing NDVI
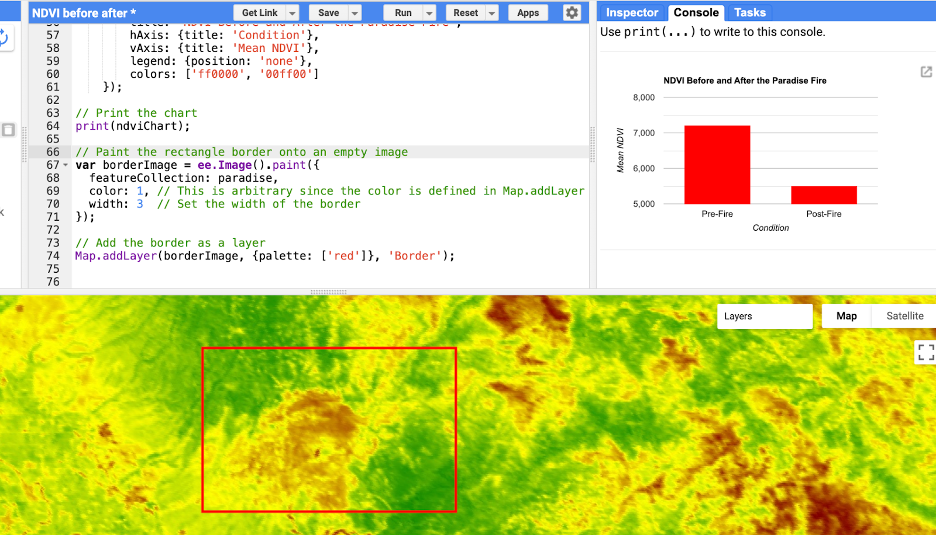
The code sets visualization parameters with visParams, which includes the NDVI band, a scale from 0 to 9000 (reflecting NDVI values), and a color palette to visually represent different NDVI values on the map. The pre- and post-fire NDVI layers are then added to the map using Map.addLayer, allowing for visual comparison of vegetation health.
Step 6: Analyzing and Charting NDVI Values
To facilitate further analysis, the code creates a feature collection (ndviFeatureCollection) that includes the average NDVI values before and after the fire. It then generates a bar chart (ndviChart) to visually compare these values, highlighting the impact of the fire on vegetation health.
Step 7: Adding a Border for Visualization
Finally, the code visually emphasizes the area of interest (Paradise) by drawing a red border around it. This is done by painting the paradise rectangle onto an empty image and then adding this border as a layer on the map.
This code effectively uses Google Earth Engine to assess the impact of the Paradise Fire on vegetation by comparing NDVI values before and after the event.
// Define the time range for before and after the wildfire
// Paradise Fire was November 8–25, 2018
var preFireStart = '2018-01-01';
var preFireEnd = '2018-10-31';
var postFireStart = '2018-12-01';
var postFireEnd = '2019-06-30';

// Roughly the town of Paradise
var paradise = ee.Geometry.Rectangle(-121.7, 39.7, -121.3, 39.9);

// Use the MODIS vegetation indices product
var dataset = ee.ImageCollection('MODIS/061/MOD13Q1')
                .filterBounds(paradise)
                .select('NDVI');

// Calculate average NDVI before the fire
var preFireNDVI = dataset.filterDate(preFireStart, preFireEnd)
                         .mean();

// Calculate average NDVI after the fire
var postFireNDVI = dataset.filterDate(postFireStart, postFireEnd)
                          .mean();

// Define the visualization parameters
var visParams = {
  bands: ['NDVI'],
  min: 0,
  max: 9000,
  palette: ['maroon', 'yellow', 'green']
};

// Add pre-fire NDVI layer
Map.addLayer(preFireNDVI, visParams, 'Pre-Fire NDVI');

// Add post-fire NDVI layer
Map.addLayer(postFireNDVI, visParams, 'Post-Fire NDVI');

// Define a feature collection with NDVI values for charting
var ndviFeatureCollection = ee.FeatureCollection([
    ee.Feature(null, {condition: 'Pre-Fire', NDVI: preFireNDVI.reduceRegion({
        reducer: ee.Reducer.mean(),
        geometry: paradise,
        scale: 500
    }).get('NDVI')}),
    ee.Feature(null, {condition: 'Post-Fire', NDVI: postFireNDVI.reduceRegion({
        reducer: ee.Reducer.mean(),
        geometry: paradise,
        scale: 500
    }).get('NDVI')})
]);

// Generate a bar chart comparing pre-fire and post-fire NDVI
var ndviChart = ui.Chart.feature.byFeature(ndviFeatureCollection, 'condition', 'NDVI')
    .setChartType('ColumnChart')
    .setOptions({
        title: 'NDVI Before and After the Paradise Fire',
        hAxis: {title: 'Condition'},
        vAxis: {title: 'Mean NDVI'},
        legend: {position: 'none'},
        colors: ['ff0000', '00ff00']
    });

// Print the chart
print(ndviChart);

// Paint the rectangle border onto an empty image
var borderImage = ee.Image().paint({
  featureCollection: paradise,
  color: 1, // This is arbitrary since the color is defined in Map.addLayer
  width: 3  // Set the width of the border
});

// Add the border as a layer
Map.addLayer(borderImage, {palette: ['red']}, 'Border');
Recap
Here’s what we learned in this training:
Temporal Analysis: Comparing data from specific time frames (before and after a significant event) to measure impact on the environment.
Visualization Techniques: Presenting geospatial data through map layers and bar charts to visually depict changes in vegetation health.